Dashboard

This role has a £39,985 median salary ¹.
description:A Data Analyst collects, cleans, and interprets data, using tools like Excel, SQL, and Tableau to analyze trends and provide insights for decisions.
This role has a £39,985 median salary ¹.
Offered by


This role has a £59,930 median salary ¹.
description:A Business Intelligence Analyst analyzes and visualizes data to support business decisions, using Tableau and Power BI to drive strategy.
This role has a £59,930 median salary ¹.
Offered by


Most popular
 Status: Free TrialStatus: AI skills
Google
 Status: Free TrialStatus: AI skills
 Status: Free TrialStatus: AI skills
 Status: Free Trial
University of London
Trending now
- Status: Free TrialStatus: AI skills
Google
- Status: Free TrialStatus: AI skills
 Status: Free Trial
 Status: Free Trial
New releases
 Status: Free Trial
University of Colorado Boulder
 Status: Free Trial
 Status: Free Trial
Simplilearn
 Status: Free Trial
Filter by
SubjectRequired
LanguageRequired
The language used throughout the course, in both instruction and assessments.
Learning ProductRequired
LevelRequired
DurationRequired
SubtitlesRequired
EducatorRequired
Results for "dashboard"
 Status: NewStatus: Free Trial
Skills you'll gain: Data Storytelling, Data Presentation, Data Visualization Software, Data Visualization, Interactive Data Visualization, Dashboard, Tableau Software, Microsoft Excel, Excel Formulas, Pivot Tables And Charts, Business Intelligence, Performance Tuning, Data Analysis, AI Personalization, Analytics, Analytical Skills, Business Metrics
Coursera Project Network
Skills you'll gain: Plotly, Dashboard, Pandas (Python Package), Data Manipulation, Interactive Data Visualization, Data Visualization Software, Data Visualization, Web Applications, Data Science, Data Analysis, Python Programming
Coursera Project Network
Skills you'll gain: Data Visualization, Business Analytics, Dashboard, Data Analysis, Data Storytelling, Google Analytics, Marketing Analytics, Data-Driven Decision-Making, Business Metrics, Data Integration, Google Ads

Illinois Tech
Skills you'll gain: Capital Budgeting, Microsoft Excel, Dashboard, Pivot Tables And Charts, Productivity Software, Spreadsheet Software, Excel Formulas, Data Visualization, Financial Analysis, Data Analysis Expressions (DAX), Finance, Business Mathematics, Microsoft Office, Financial Modeling, Google Sheets, Key Performance Indicators (KPIs), Data-Driven Decision-Making
 Status: Free
Coursera Project Network
Skills you'll gain: Data Transformation, Power BI, Data Manipulation, Data Cleansing, Data Processing, Dashboard, Data Visualization, Data Presentation, Data Import/Export, Interactive Data Visualization, Data Visualization Software, Business Intelligence, Data Storytelling, Data Modeling, Business Reporting
Coursera Project Network
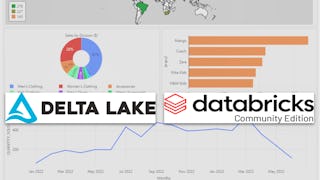
Skills you'll gain: Databricks, Data Lakes, Data Pipelines, Data Integration, Dashboard, PySpark, SQL, Apache Spark, Data Management, Data Transformation, Version Control
Coursera Project Network
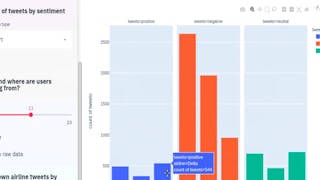
Skills you'll gain: Data Storytelling, Data Presentation, Data-Driven Decision-Making, Data Visualization, Interactive Data Visualization, Dashboard, Data Visualization Software, Tableau Software, Data Analysis, Exploratory Data Analysis
 Status: Free
Coursera Project Network
Skills you'll gain: Power BI, Interactive Data Visualization, Data Visualization, Data Presentation, Dashboard, Trend Analysis, Exploratory Data Analysis, Customer Analysis, Data Visualization Software, Sales, Business Intelligence, Data Analysis, Business Analytics, Data Import/Export
 Status: NewStatus: Preview
Coursera Instructor Network
Skills you'll gain: Data Storytelling, Dashboard, Data Presentation, Power BI, Strategic Decision-Making, Interactive Data Visualization, Tableau Software, Storytelling, Data-Driven Decision-Making, Executive Presence, Business Intelligence, User Feedback, Data Visualization, Presentations, Constructive Feedback, Analytics, Customer Insights, Data Structures
 Status: Free Trial
Skills you'll gain: Microsoft Power Platform, Microsoft Power Automate/Flow, Power BI, Dashboard, No-Code Development, Data Visualization, Business Intelligence, Business Process Automation, Application Development, Data Integration, Performance Analysis, Application Design, Data Security, Generative AI Agents, Business Process, Microsoft Teams, Data Analysis Software, Database Management Systems, Data Modeling, Systems Integration
 Status: Free Trial
Corporate Finance Institute
Skills you'll gain: Star Schema, Data Modeling, Tableau Software, Business Intelligence, Extract, Transform, Load, Dashboard, Performance Tuning, Technical Analysis, Database Design, Data Visualization Software, Data Warehousing, Market Data, Data Transformation, Data Presentation, Investment Banking, Exploratory Data Analysis, Tree Maps, Interactive Data Visualization, Data Storytelling, Data Visualization
 Status: New
Skills you'll gain: Data Storytelling, Tableau Software, Dashboard, Interactive Data Visualization, Data Visualization Software, Data Analysis, Sales Strategy, Key Performance Indicators (KPIs), Trend Analysis, Data Mapping, Investment Management, Financial Data

